semarx
Self-healing supply chains, from the shipment up
A digital twin for every shipment, not one digital twin of the whole supply chain. We measure predictability on every leg, along every shipment’s path and across the whole network. Each shipment adjusts its route as the predictability of its path changes, and the network learns from every leg.
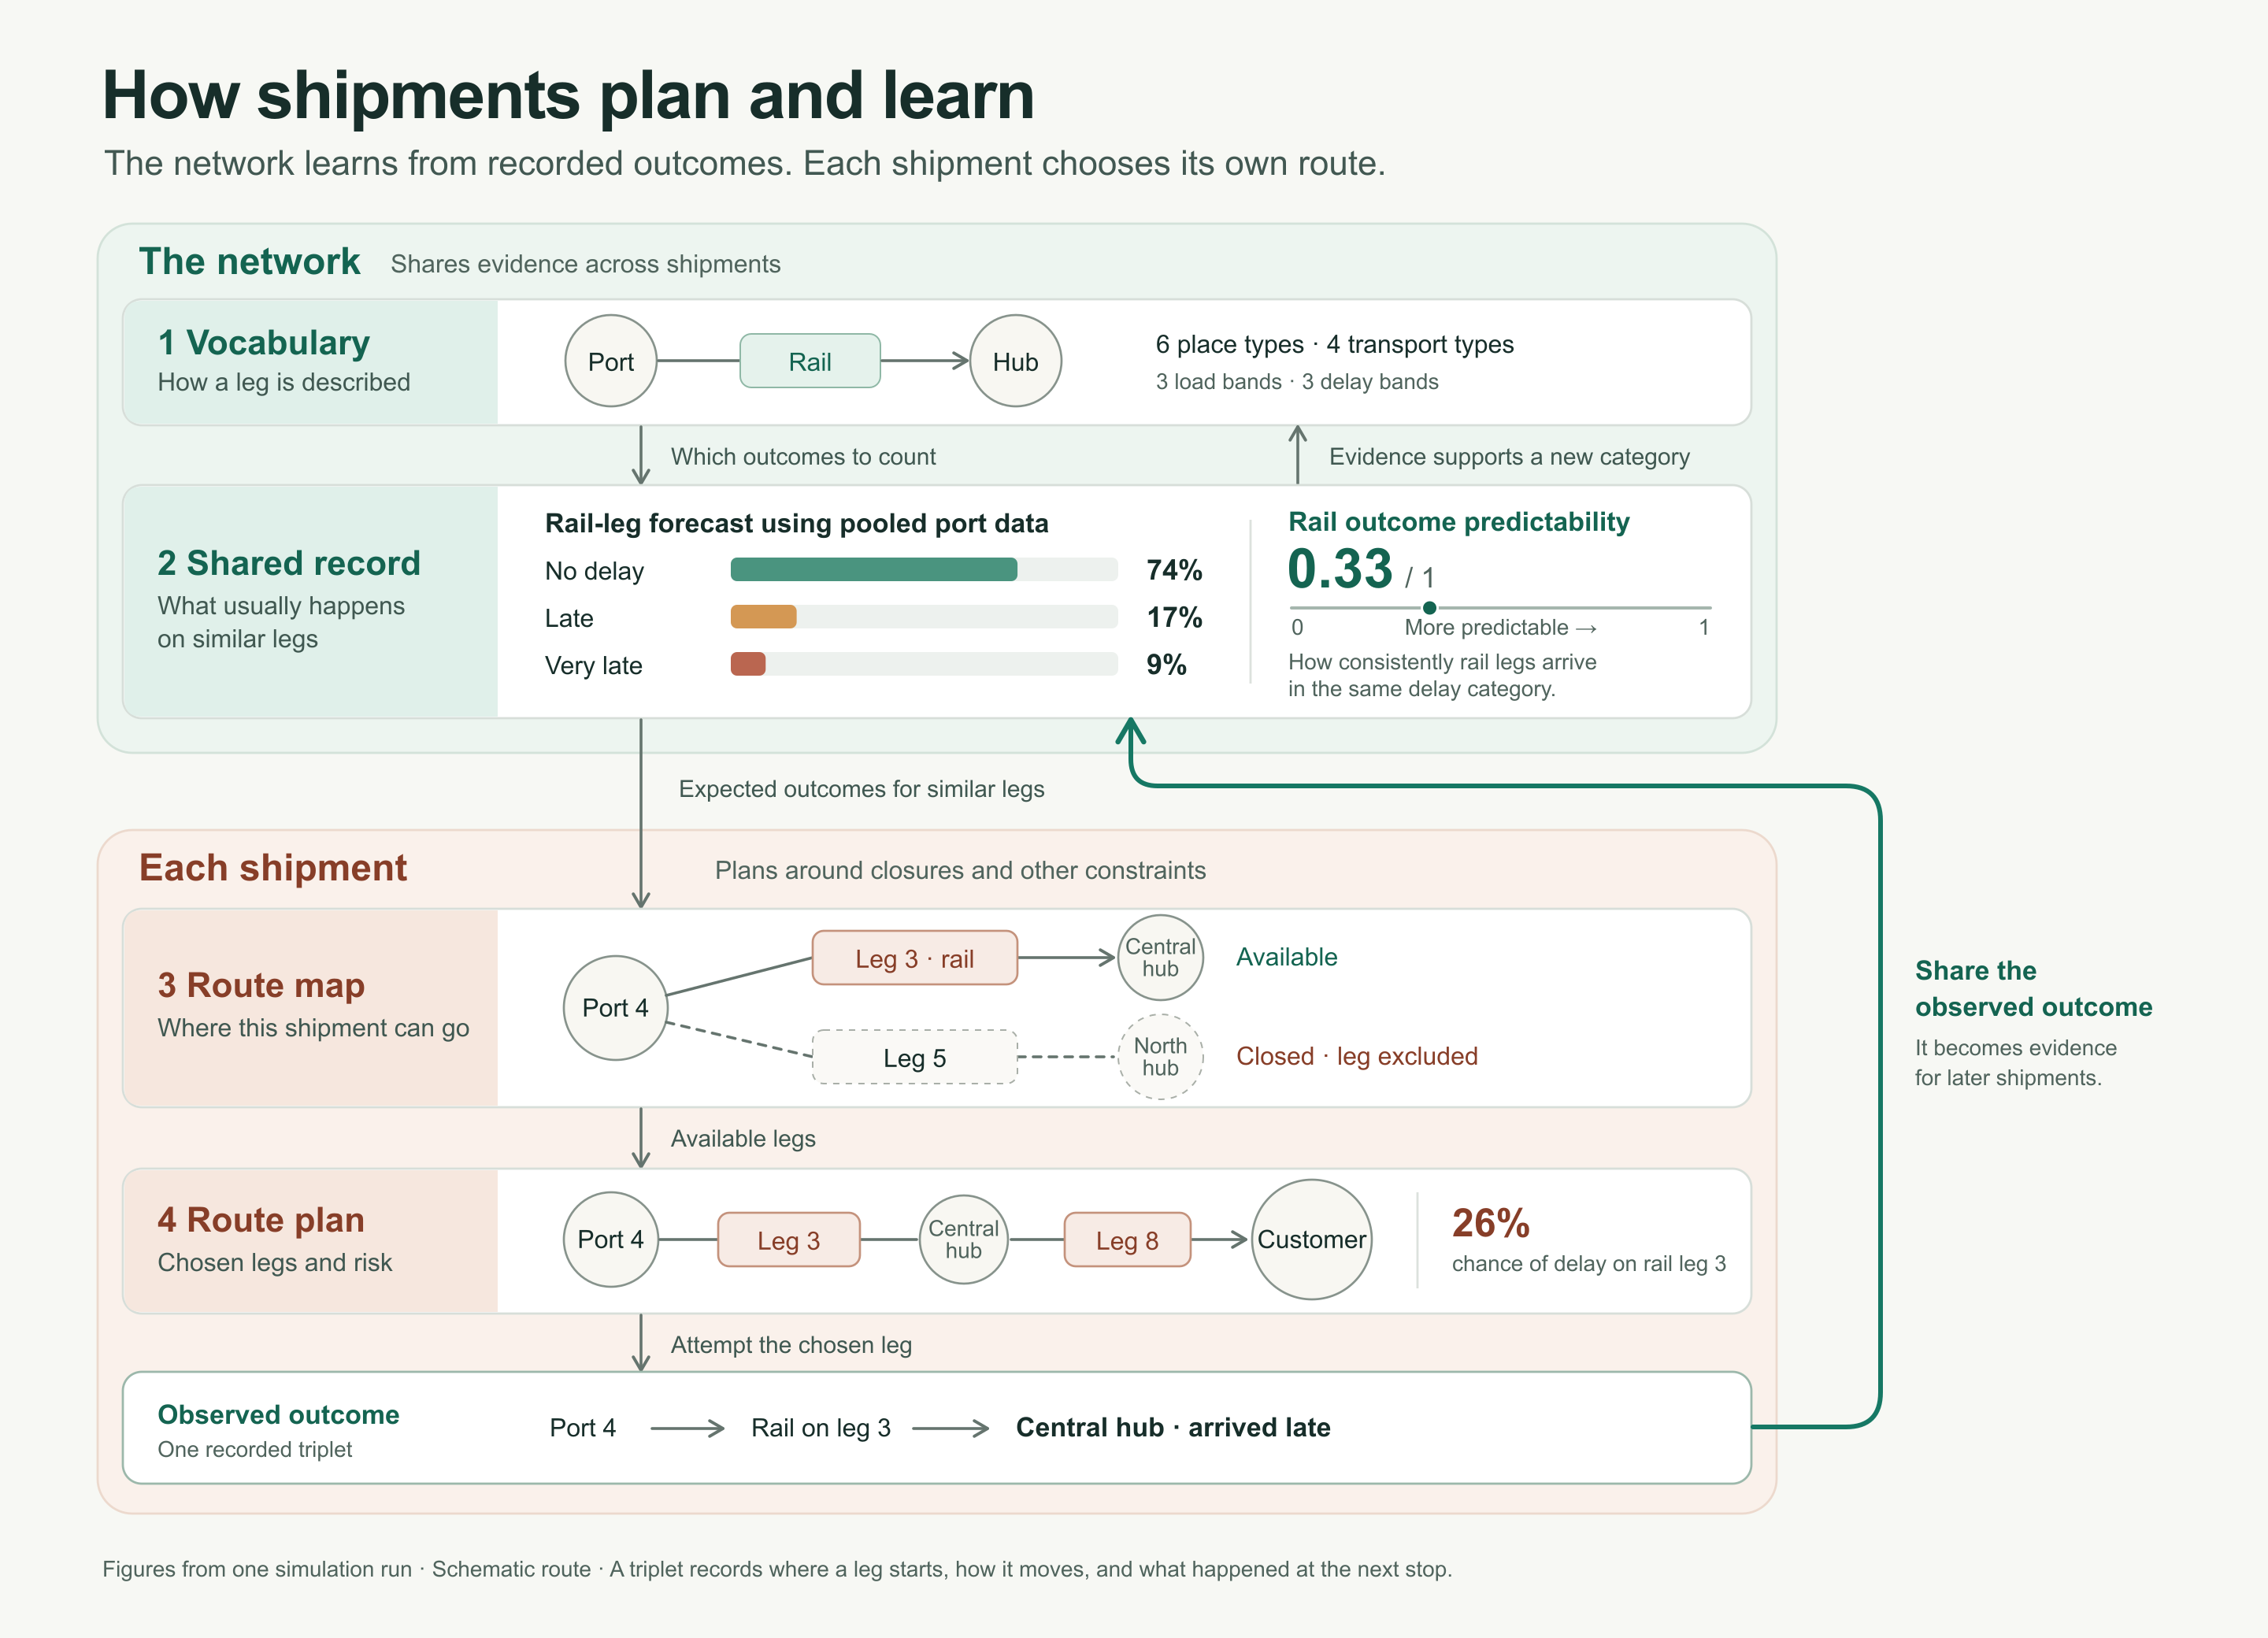

Reading the figure
-
Vocabulary. Every leg is one triplet: where it started, how it moved, where it ended up (port → rail → hub). Shared types let legs from different places add up.
-
Shared record. Counting triplets shows what usually happens on each kind of leg: port rail legs are 74% no delay, 17% late, 9% very late, a predictability of 0.33 out of 1. When predictability drops, the process on that kind of leg has changed.
-
Route map. Each shipment digital twin keeps the legs it can still use and reads the predictability of each. The leg to the closed North hub is excluded.
-
Route plan. The shipment digital twin chooses its legs and reads their risk from the shared record: a 26% chance of delay on rail leg 3. When the predictability of its path changes, it rebuilds its plan.
-
Observed outcome. Each completed leg becomes one triplet of evidence for every later shipment.
Predictability, not only outcomes
What others measure
The question: Did the shipment arrive on time?
The signal: on-time rate, cost, error in estimated arrival time
When it moves: after outcomes have moved
Who acts on it: a central twin, for all shipments
What we measure
The question: How sure is the next step, given where the shipment is and how it moves?
The signal: predictability of every leg, every path and the whole supply chain
When it moves: as the process itself changes
Who acts on it: each shipment digital twin, on its own path
Results at a glance
In a simulated supply chain of 300 places, about 1,200 truck, rail, sea and air lanes, and 60 new shipments a day:
Predictability showed where the process changed, and the cause was named. Rail out of a busy port degraded without notice. Its predictability fell by more than half within seven weeks while other ports held steady. The network named rail access as the cause in 6 of 6 runs, with no false alarms in runs where nothing changed.
The lesson reached a place with almost no data of its own. A quiet port with the same rail access inherited it: its rail leg’s expected delay rose from 26% to 37%, and its forecasts improved in 4 of 4 runs.
Shipments rebuilt their paths around a closed hub. With the shared record, 8 of 24 and 6 of 18 shipments dropped a closed lane before reaching it; without sharing, none did (0 of 21).